
SEPTEMBER 2023 RELEASES
September 2023 Releases
The Regal Observability Dashboard is built to give your team visibility into AI agent performance, so you always know what your agents are actually doing once they're live.
Customer expectations for AI experiences have risen fast. Callers in healthcare, insurance, and financial services expect interactions that feel natural, stay on-script, and meet regulatory requirements. That means hallucination rates, guardrail breaches, and robotic language patterns are production concerns, and measuring them in real-time is what makes sustained improvement possible. With the Observability Dashboard, you can now track all these behaviors, across every AI agent, and every call.
.webp)
The Regal Observability Dashboard is built around three things: monitoring what's happening now, making confident decisions about changes, and proving improvements over time.
.webp)
Unlike platforms where surfacing insights requires manual sampling or custom reporting, every metric on Regal surfaces automatically across every call, in real-time.
When the dashboard surfaces an uptick in action errors, you can isolate exactly which actions are failing and drill into the transcripts to see the error detail. From there, you update the agent configuration, run tests before relaunch, and avoid the kind of prolonged impact that comes from incorrect action setup or timeouts going unnoticed.
For most teams, the latency view is about monitoring baseline performance over time. But when something shifts, the dashboard makes it easy to act fast. For example, when the dashboard alerts you to a latency spike on two specific agents, your team can drill into the turn-level transcript insights and see a consistent speech model delay across those conversations.
Rather than waiting on the vendor, you switch to a backup voice model while they resolve it. Customer impact is minimal, and you have a clear record of what happened and why. Looking ahead, that failover can be automated based on thresholds you define.
In rare cases, an agent may start narrating its internal actions rather than speaking naturally to the caller. It's not common, but when it happens it can persist for days without anyone catching it. The dashboard flags the robotic language rate for the affected agent so you can review the transcripts, update the guardrail prompt and test coverage, and close the loop quickly, before affecting your customer experience.
A business decision comes up: downgrade to a lower-cost model. You make the change and watch the dashboard. Over three days, the hallucination rate moves from 2% to 4%. That's evidence you can act on: your team can decide whether that's within acceptable range for the cost savings, or switch back to the more expensive model.
.webp)
The dashboard tracks the full LLM quality, action adherence, and more across every call, in real-time.
The dashboard also tracks standard production metrics, including latency, sentiment, error rate, call time, and uptime, all surfaced automatically and linked to the individual call transcripts behind them.
Right now, it's never been easier to build an AI agent. With no-code builders, pre-trained models, off-the-shelf voice providers, you can have something running in a day. But it's also never been harder to make an AI agent enterprise-grade.
Most teams find that the build is the easy part. The hard part is everything after: guardrails, observability, knowing what your agent is doing at scale, and having the confidence to keep improving it without breaking what's already working.
Want to learn more about production-ready agents? Chat with our team.
An AI agent observability dashboard is a monitoring tool that tracks how an AI agent is performing in live production: including metrics like latency, hallucination rate, guardrail breach rate, and error rate. It gives operations teams real-time visibility into what their agents are doing and why, so they can identify issues and improve performance without relying on manual spot-checks.
Hallucination rate measures the percentage of calls in which an AI agent generated incorrect or fabricated information. Regal detects hallucinations automatically across all production calls, surfacing them in the Observability Dashboard without requiring manual sampling or transcript review.
A guardrail breach occurs when an AI agent violates a defined safety or compliance constraint — for example, straying from a required compliance statement, using prohibited language, or engaging with topics outside its designated scope. Guardrail breach rate is one of the key LLM quality metrics Regal tracks to help teams operating in regulated industries maintain compliance at scale.
With the Regal Observability Dashboard, every configuration change, prompt update, or model swap is reflected in live quality metrics. You can track how hallucination rate, guardrail breach rate, and other indicators shift in the days after a change, giving you a measurable record of improvement rather than anecdotal feedback.
In healthcare, insurance, and financial services, AI agents operate under strict compliance requirements. A hallucinated fact, an off-script statement, or a missed compliance disclosure can have real regulatory and customer consequences. Observability lets teams in these industries continuously verify that their agents are performing within required parameters, and show auditors and internal stakeholders the data to prove it.


.webp)
With AI agents, every appointment gets a confirmation call. Each contact gets a chance to reschedule, and the confirmation rate goes to 100%, not because the AI is better at conversations than your agents, but because the AI never runs out of capacity.

The fastest growing High Consideration brands have invested heavily in outbound call centers for sales and marketing. With the right technology, staffing and measurement, you too can build a high performing outbound call center to help hit your growth goals.
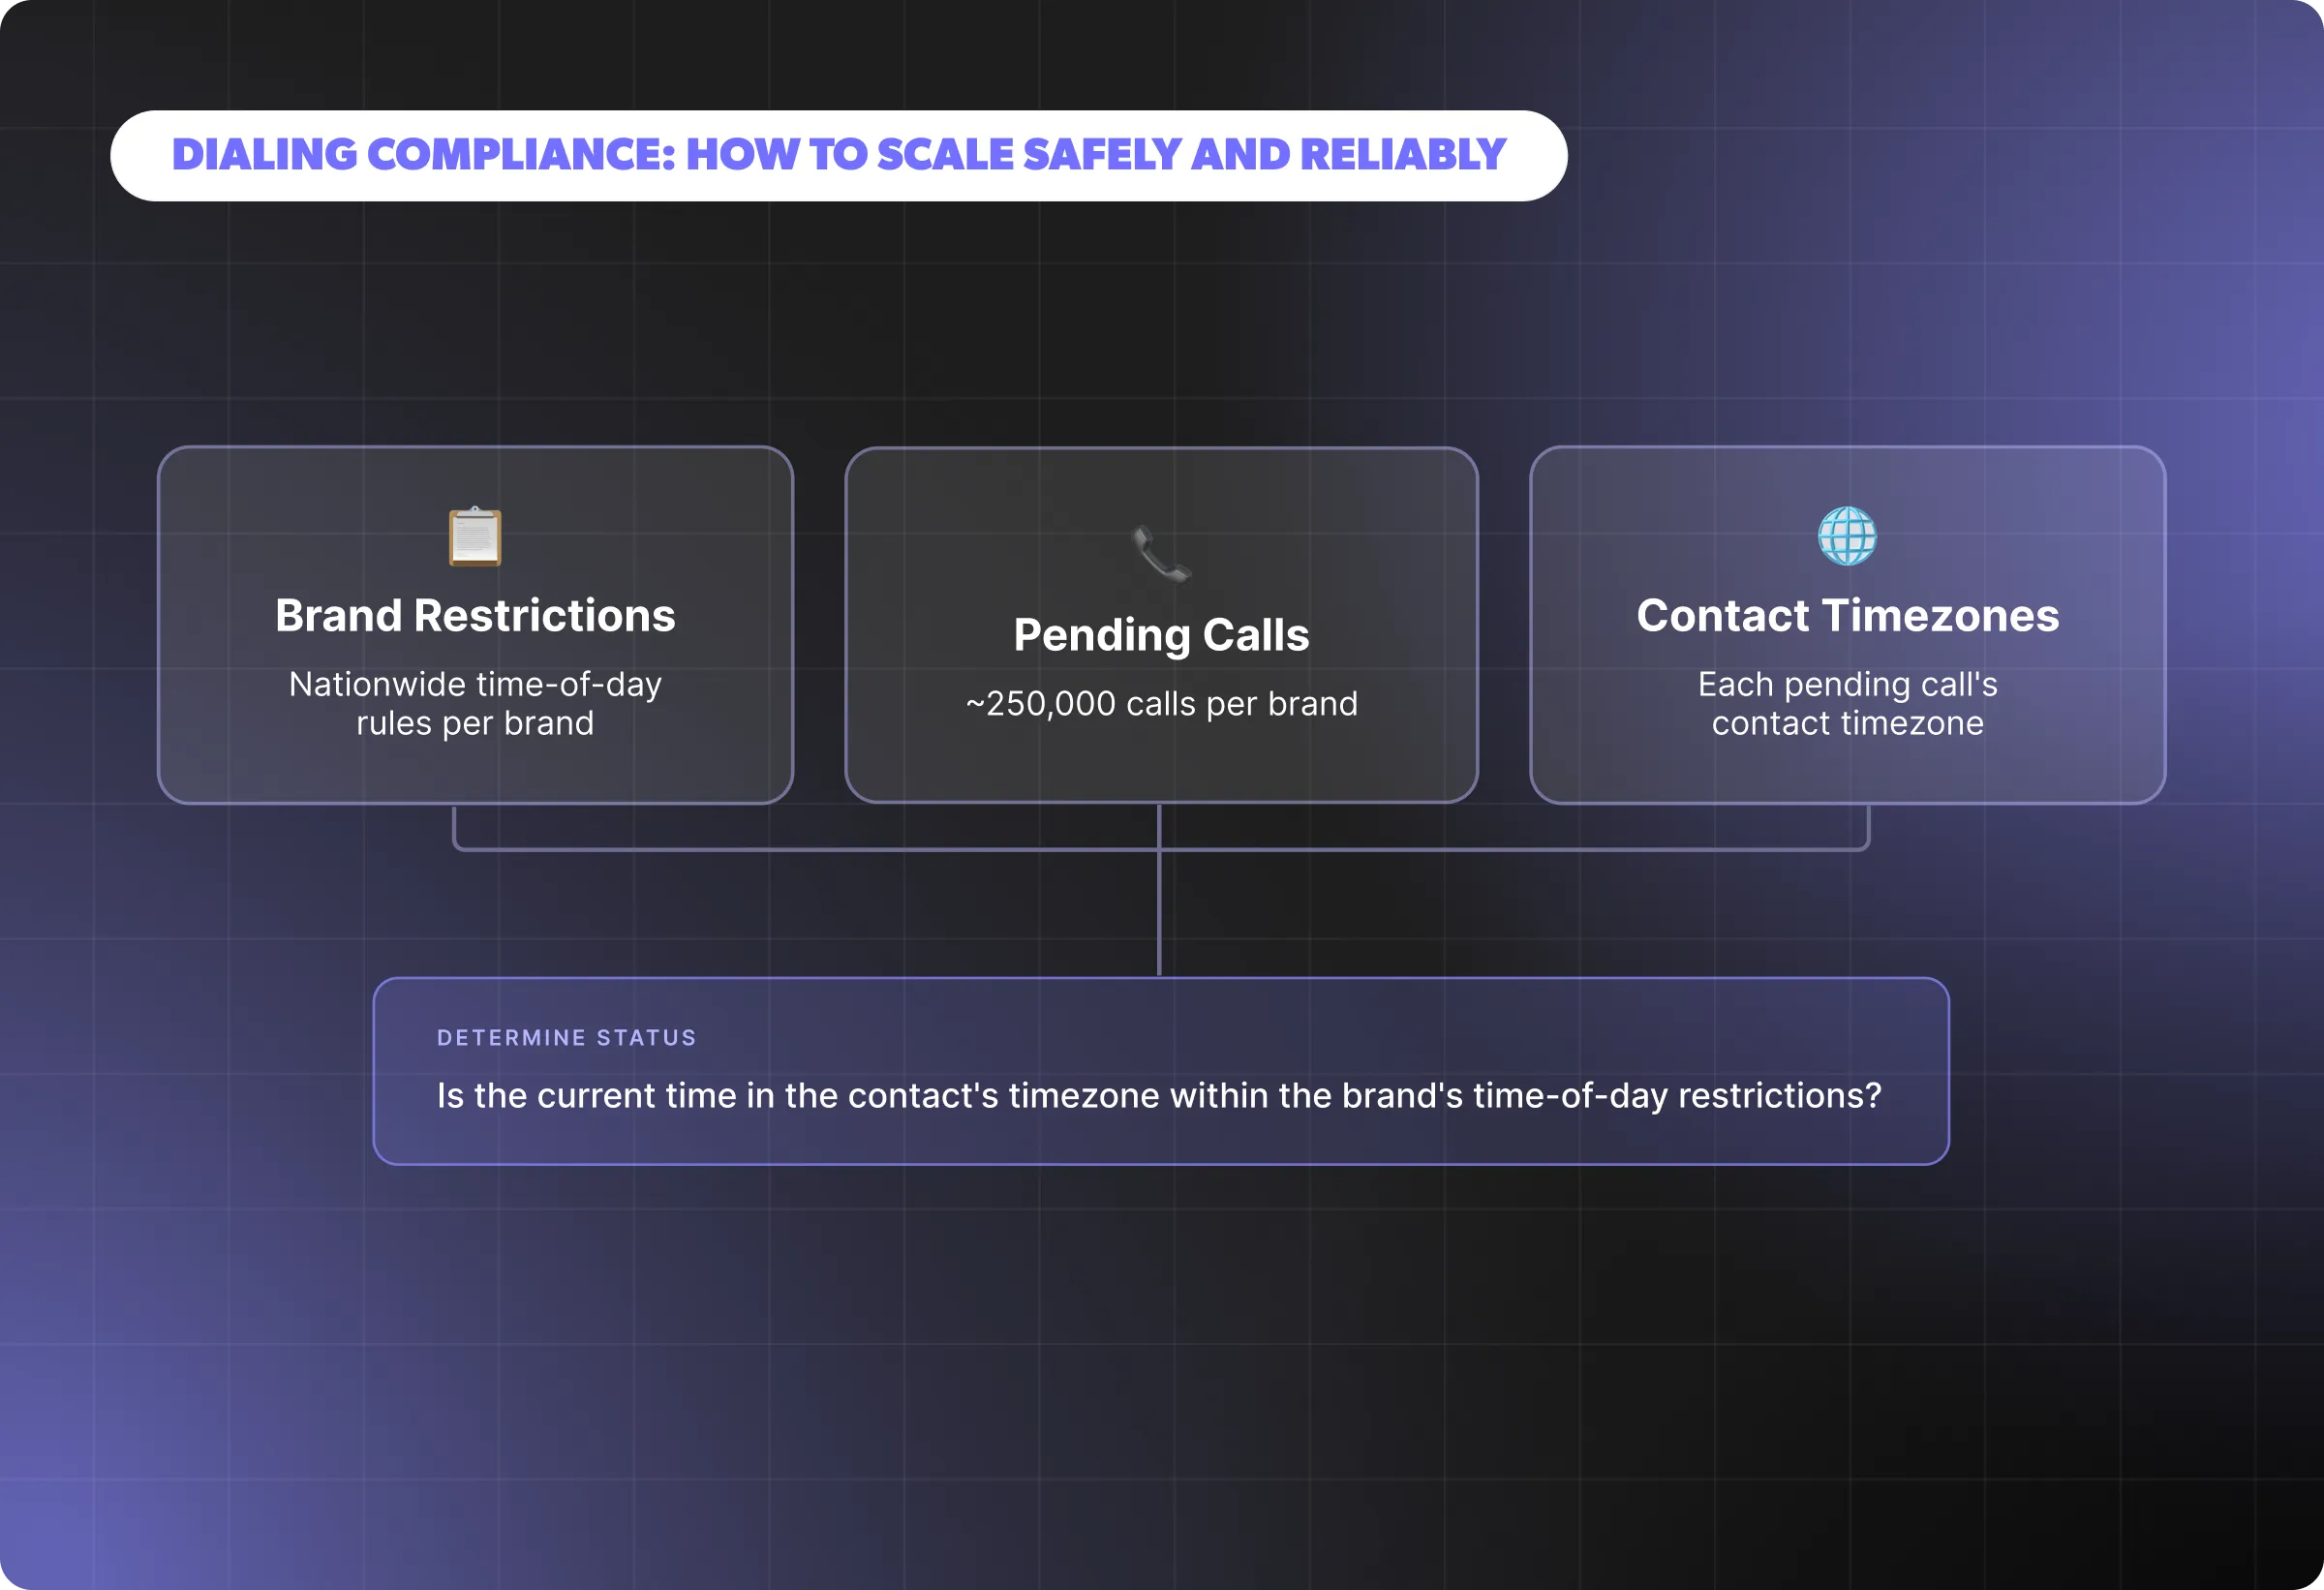
Behind a fragmented and ever-changing regulatory landscape is a simple goal: protecting people from unwanted or poorly timed outreach and giving them control over how they’re contacted. In practice, that responsibility translates into a set of checks that must be validated.

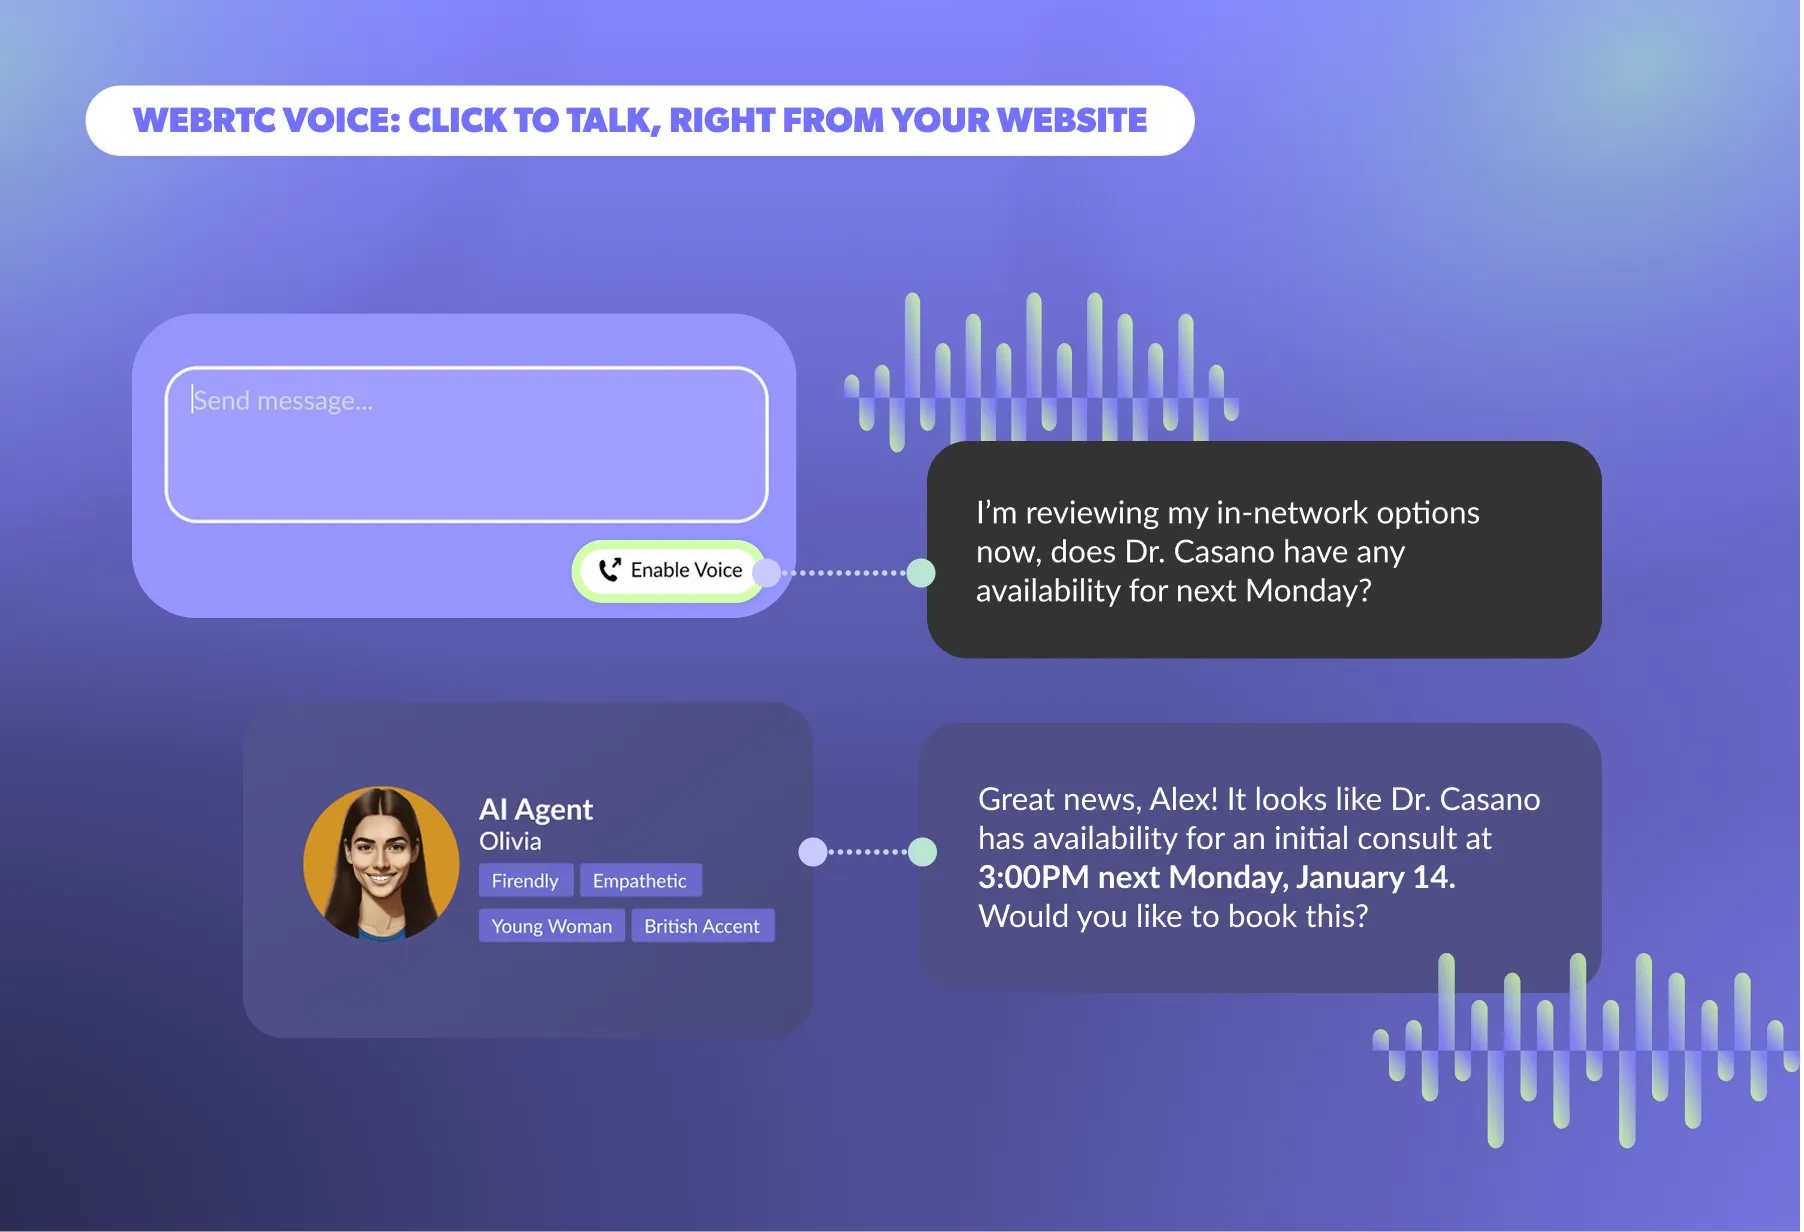
AI phone agents aren't just better phone trees. They are autonomous systems that can understand caller intent, retrieve relevant information from your CRM in real time, execute actions, handle objections and clarifications, and complete the conversation without human involvement.
.webp)
When prospects in healthcare and financial services hear "PII," they often imagine bulk data transfer: the idea that deploying an AI agent means copying a database somewhere. In most modern deployments, that's not what's happening.
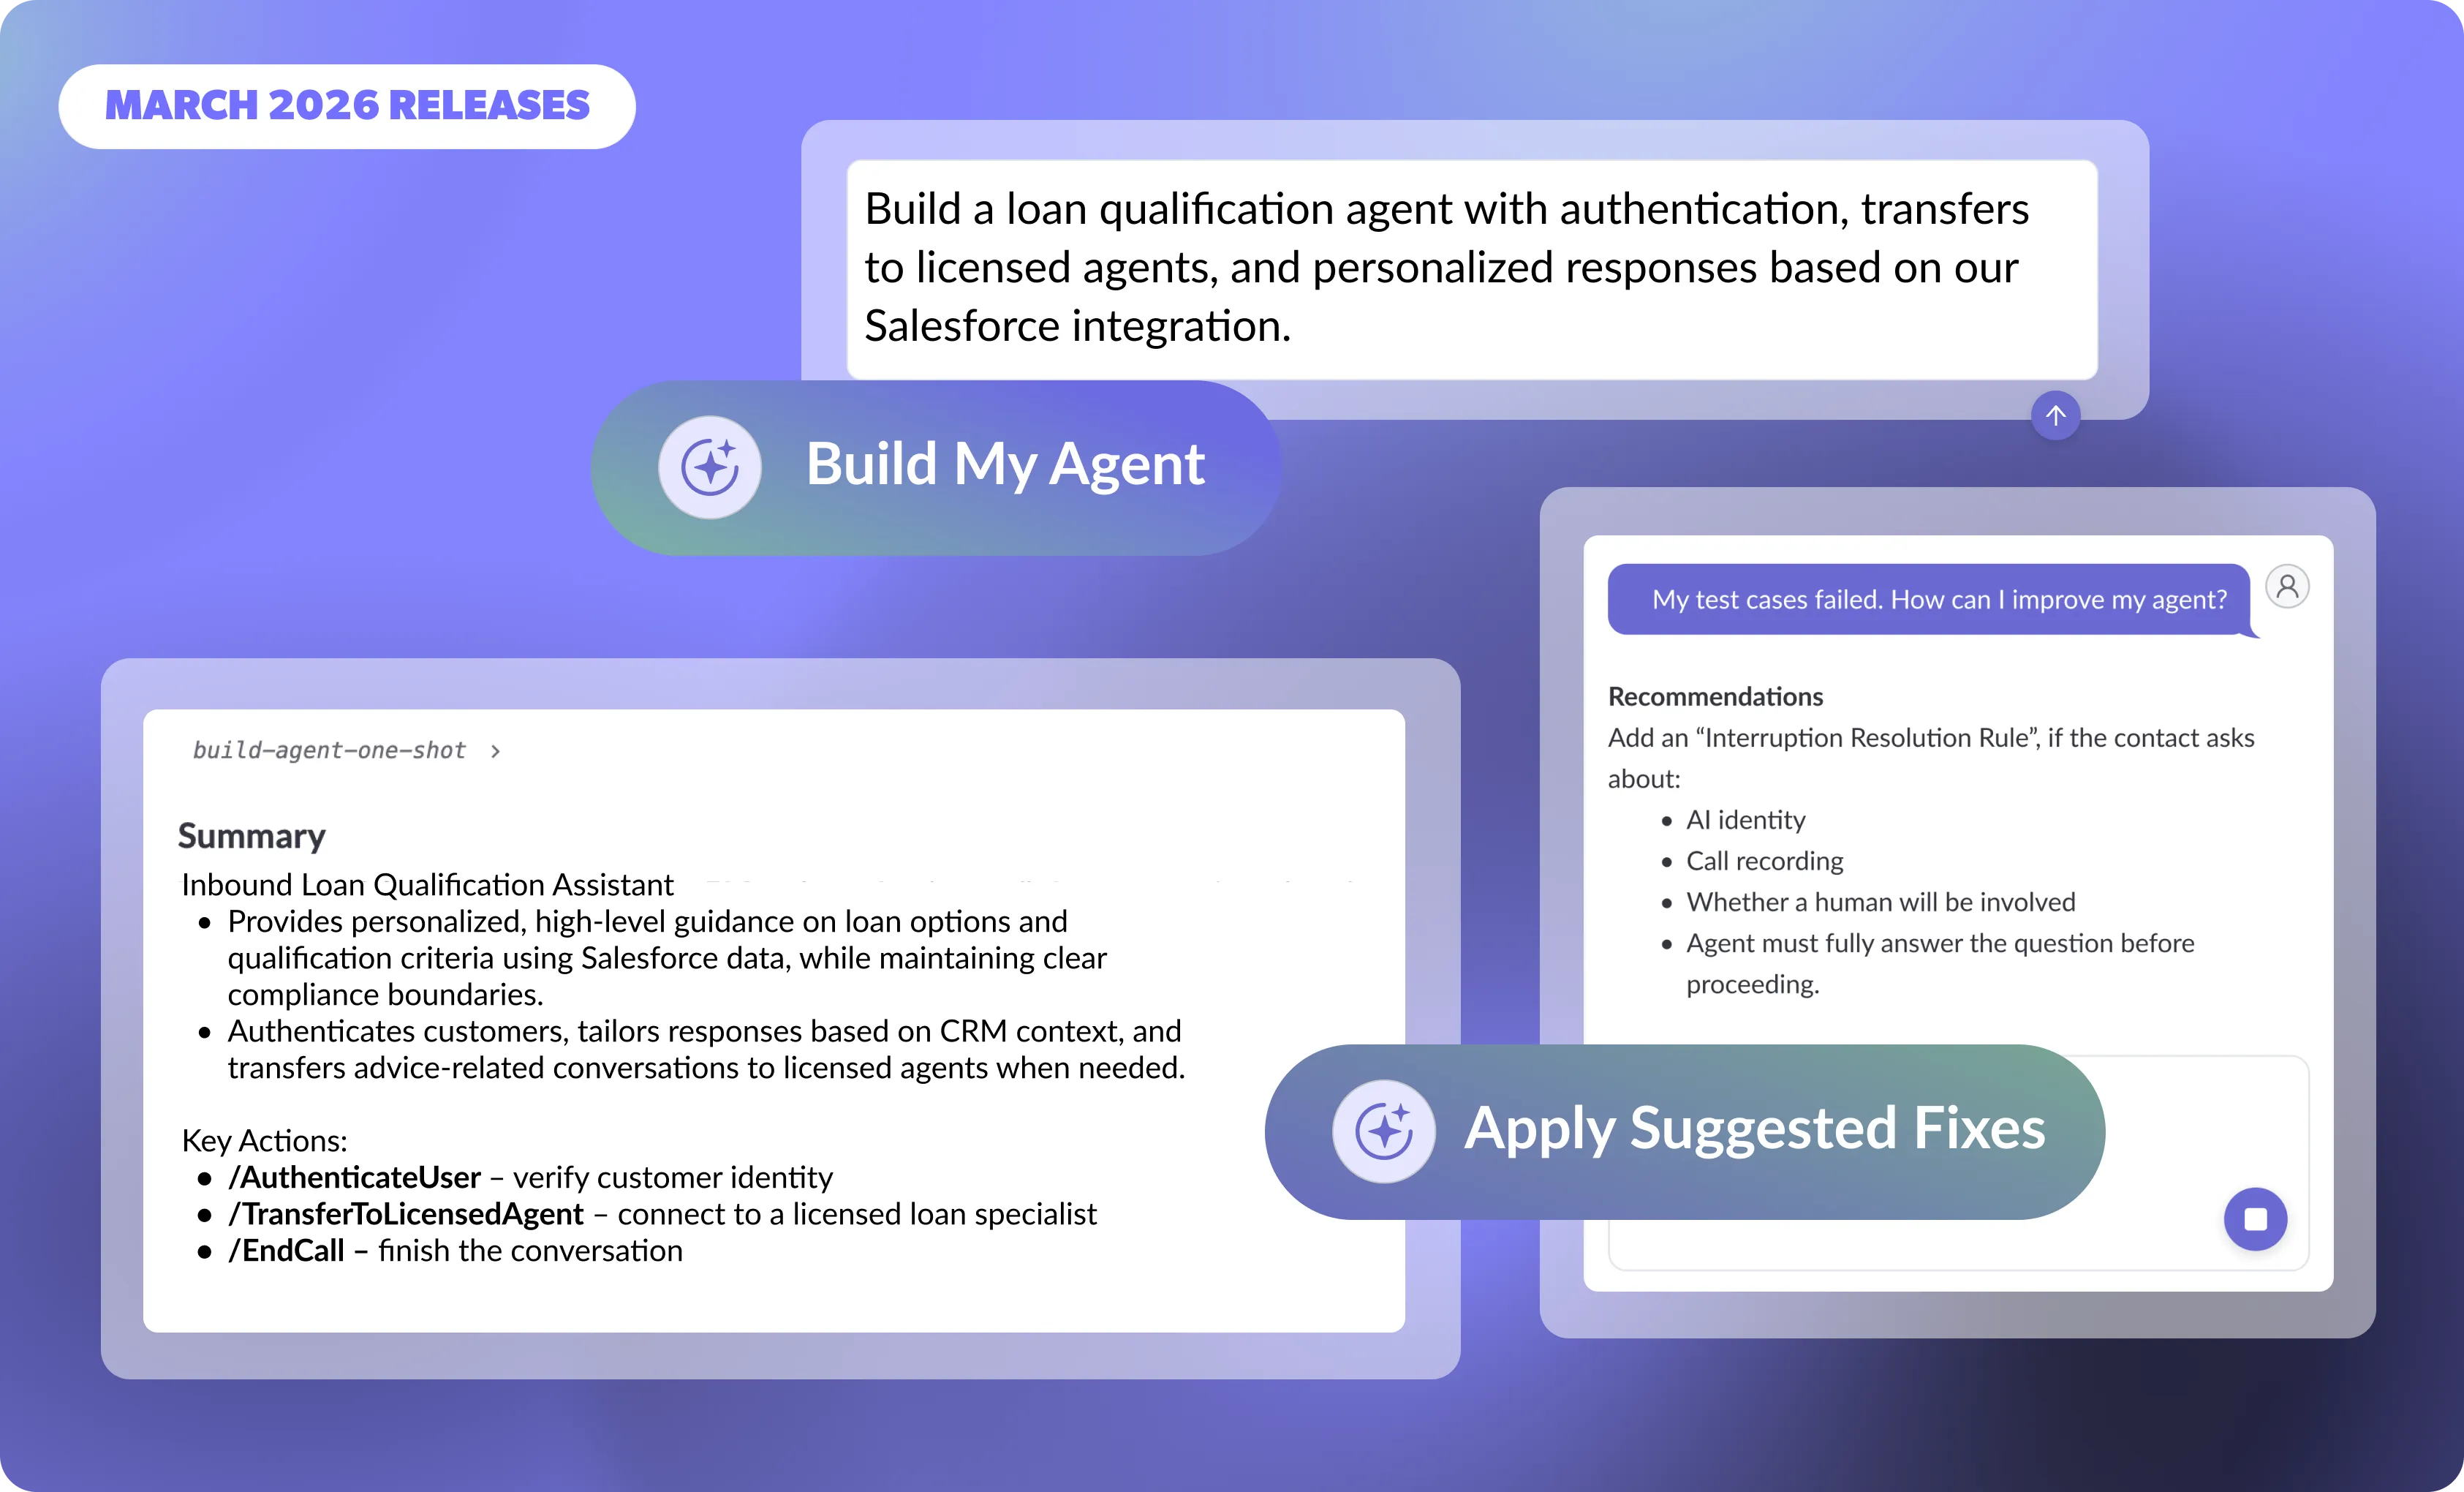
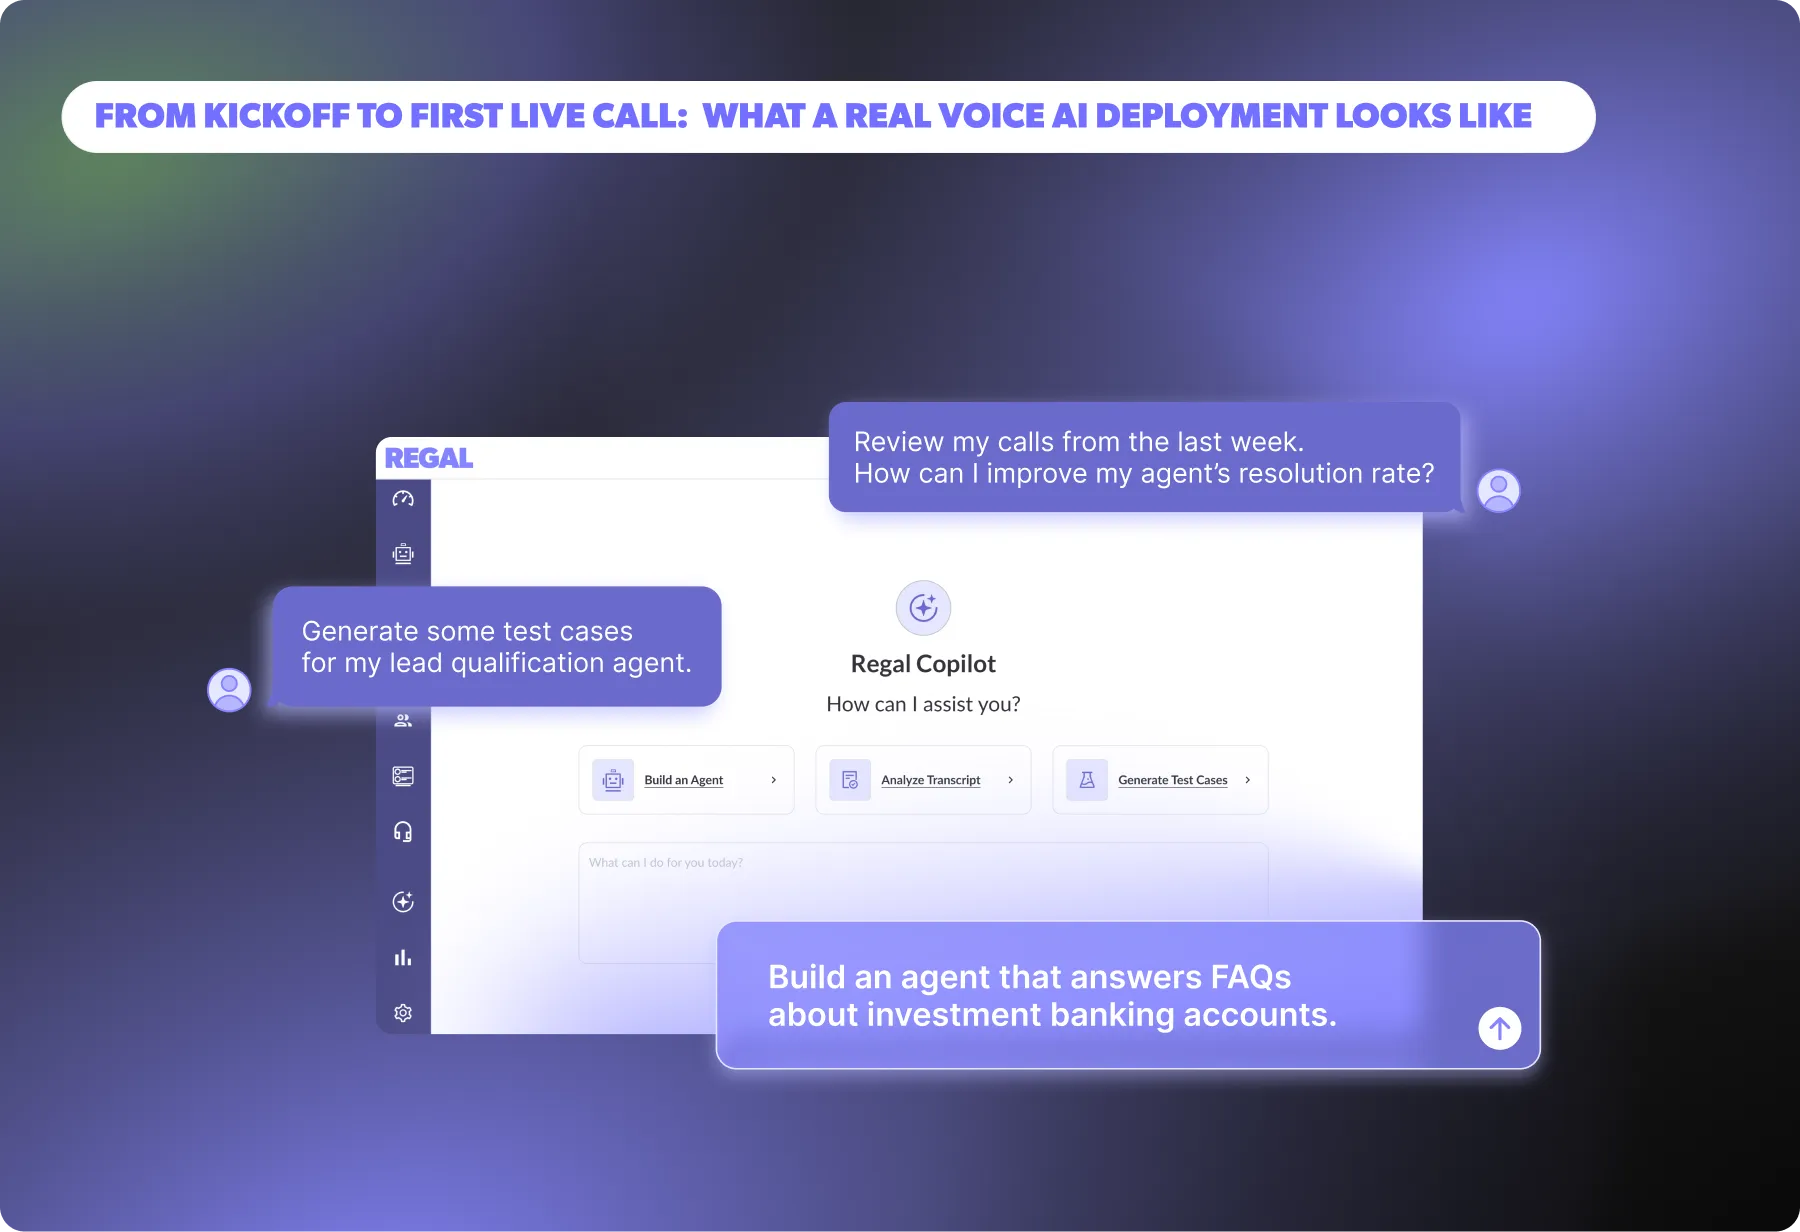
In March, we made it faster than ever to build, launch, and continuously improve AI agents with Copilot, Regal's AI agent for building AI agents. Together, these updates lessen the time needed to launch and maintain agents, so you can focus on understanding your customers, unlocking new use cases, and driving faster business outcomes.
.webp)
AI agent performance depends on how well it aligns with real customer language, not just fluency. Regal Improve helps teams identify gaps and improve outcomes by analyzing real conversations and surfacing high-impact opportunities
.webp)
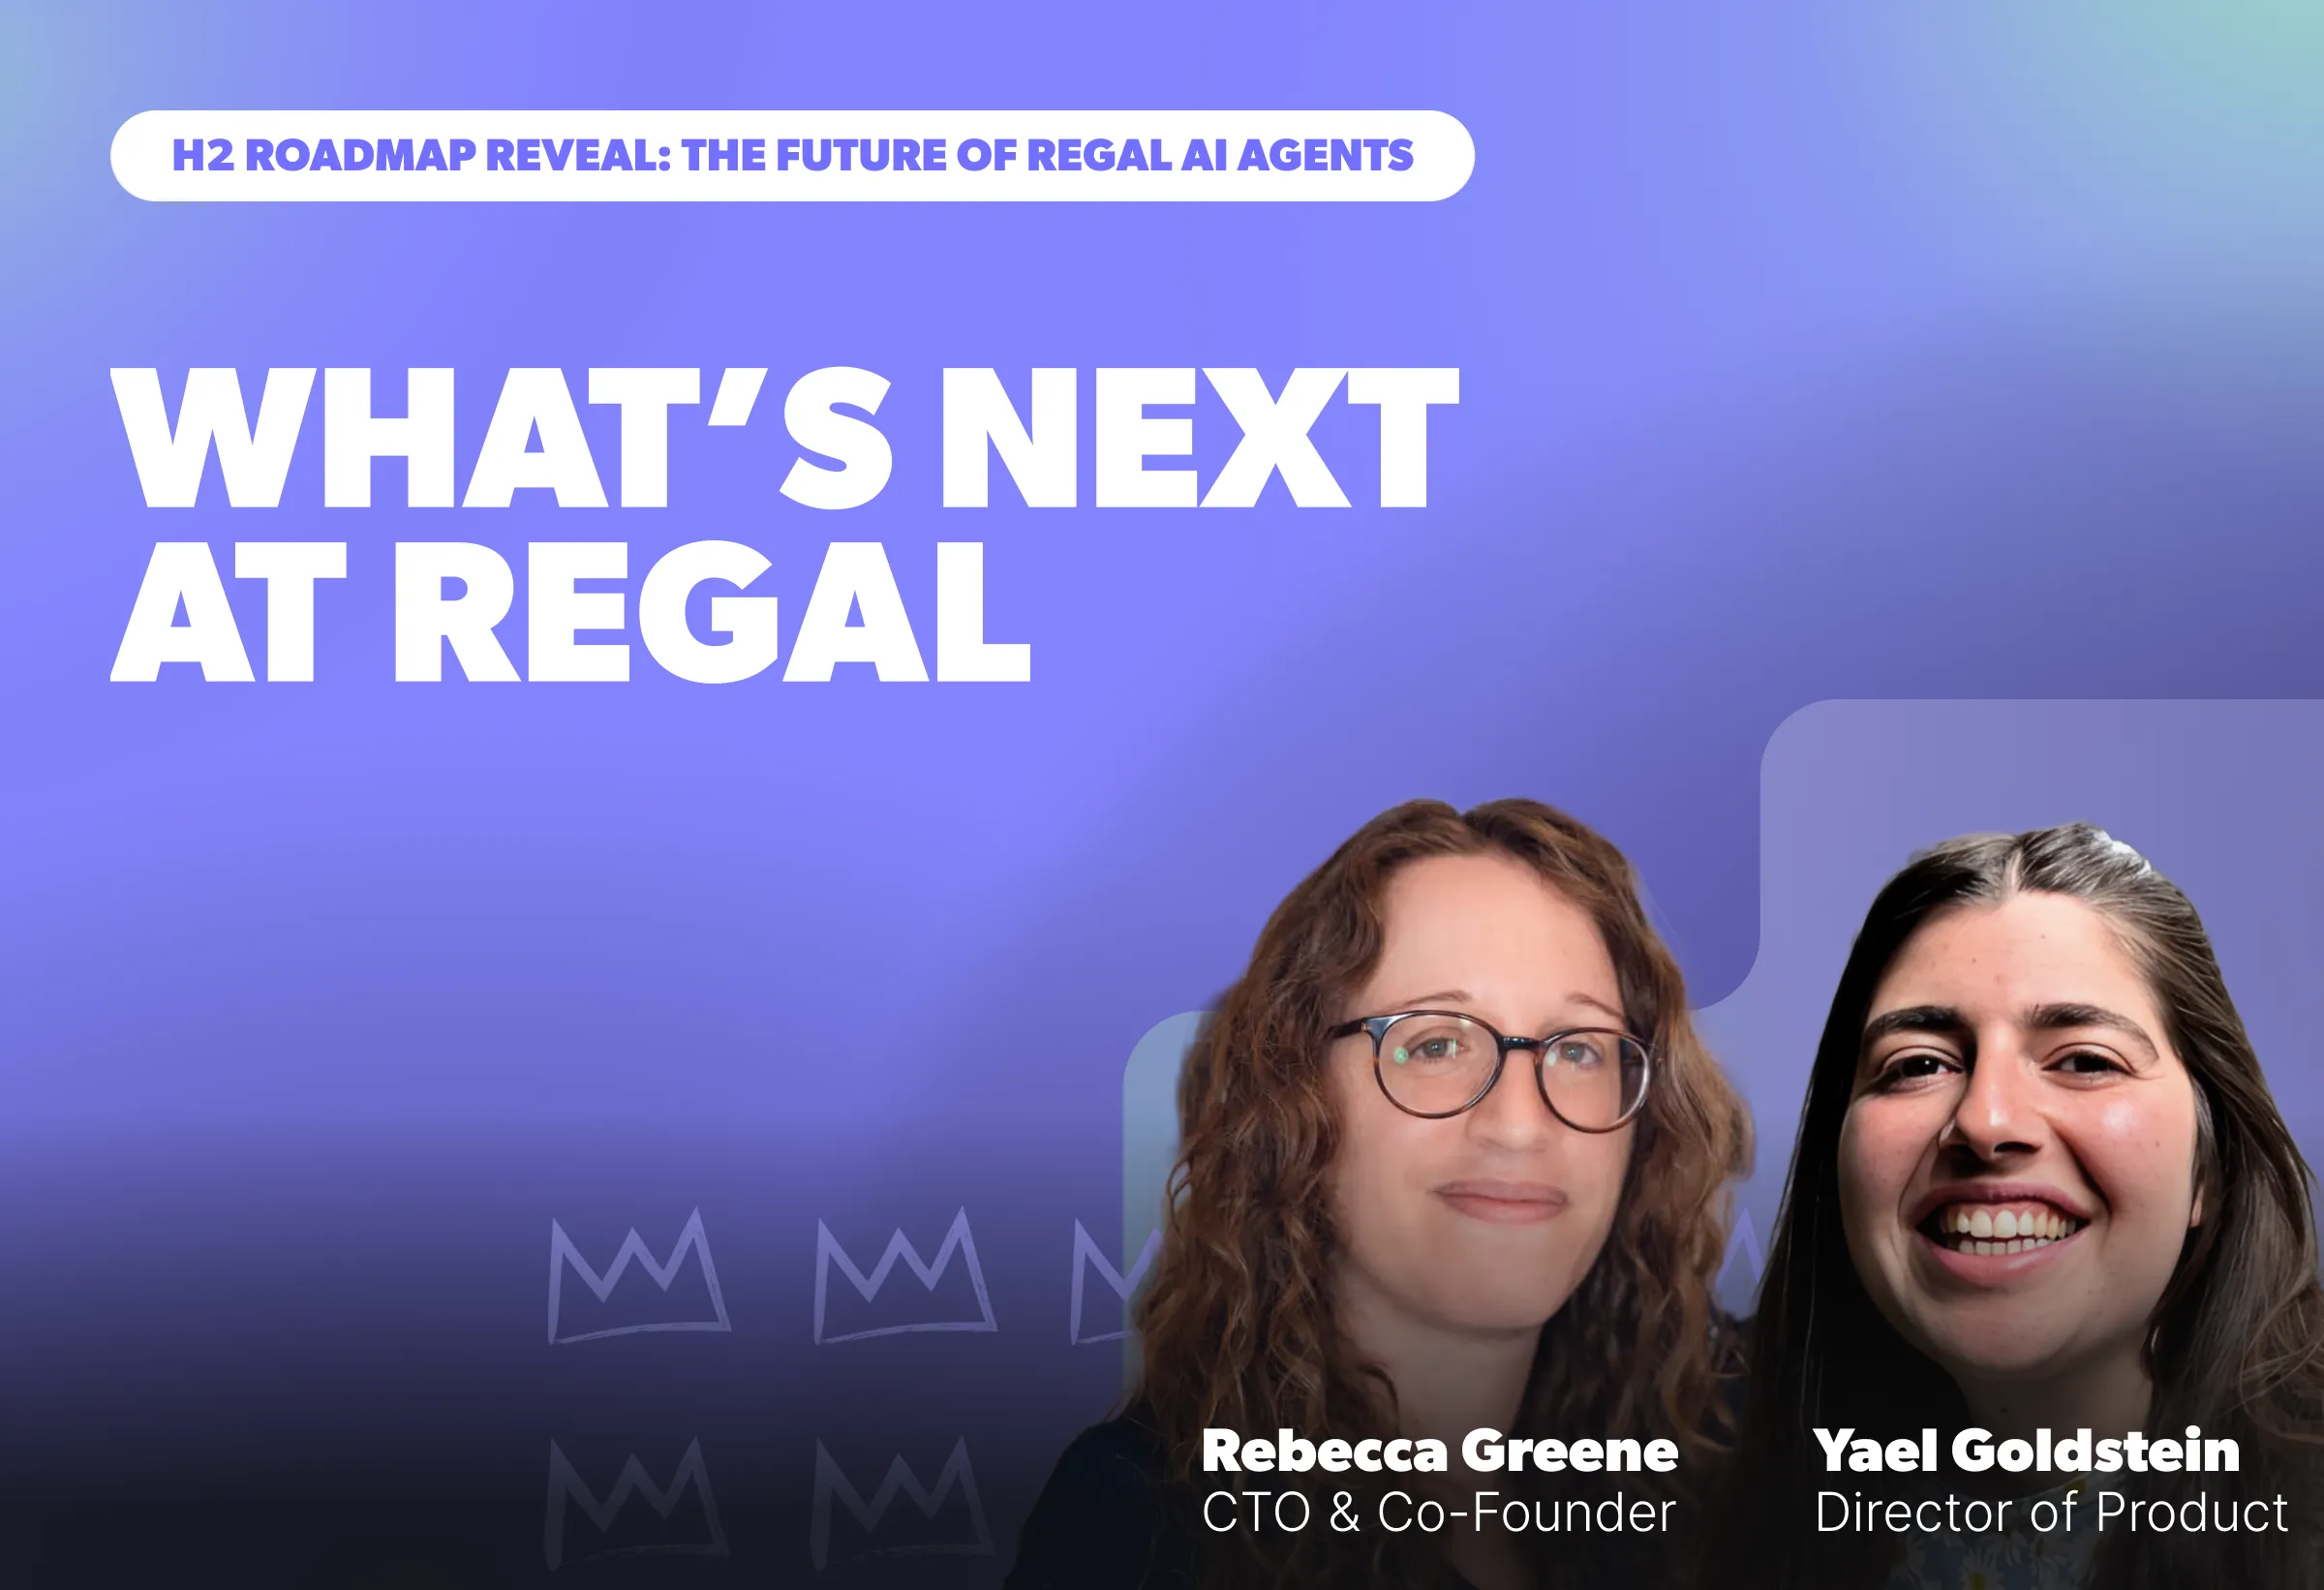
In this fireside chat, Regal Co-Founder & CEO Alex Levin sits down with Kin Insurance’s Austin Ewell and a360inc’s Henry Davidson to share how their organizations are using AI agents to transform outreach, customer experience, and operational efficiency. They discuss real-world deployments—from qualification and human agent handoffs to complex negotiation workflows—break down the results, and offer practical guidance for leaders adopting AI agents at scale.
.webp)
Learn about the difference between single-state and multi-state AI agents, and how each impacts speed, scale, and reliability. Discover when simplicity is enough and when enterprise workflows demand structured orchestration, so you can choose the right design for your use case.
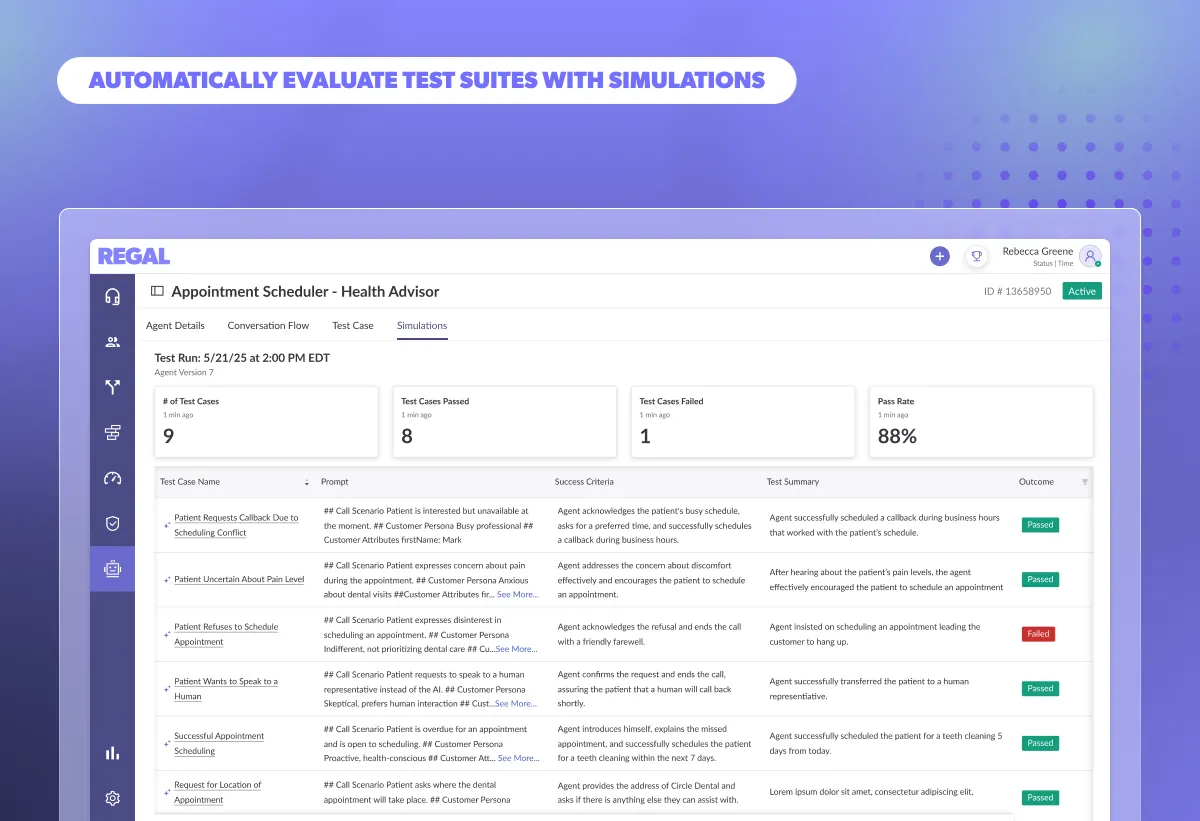
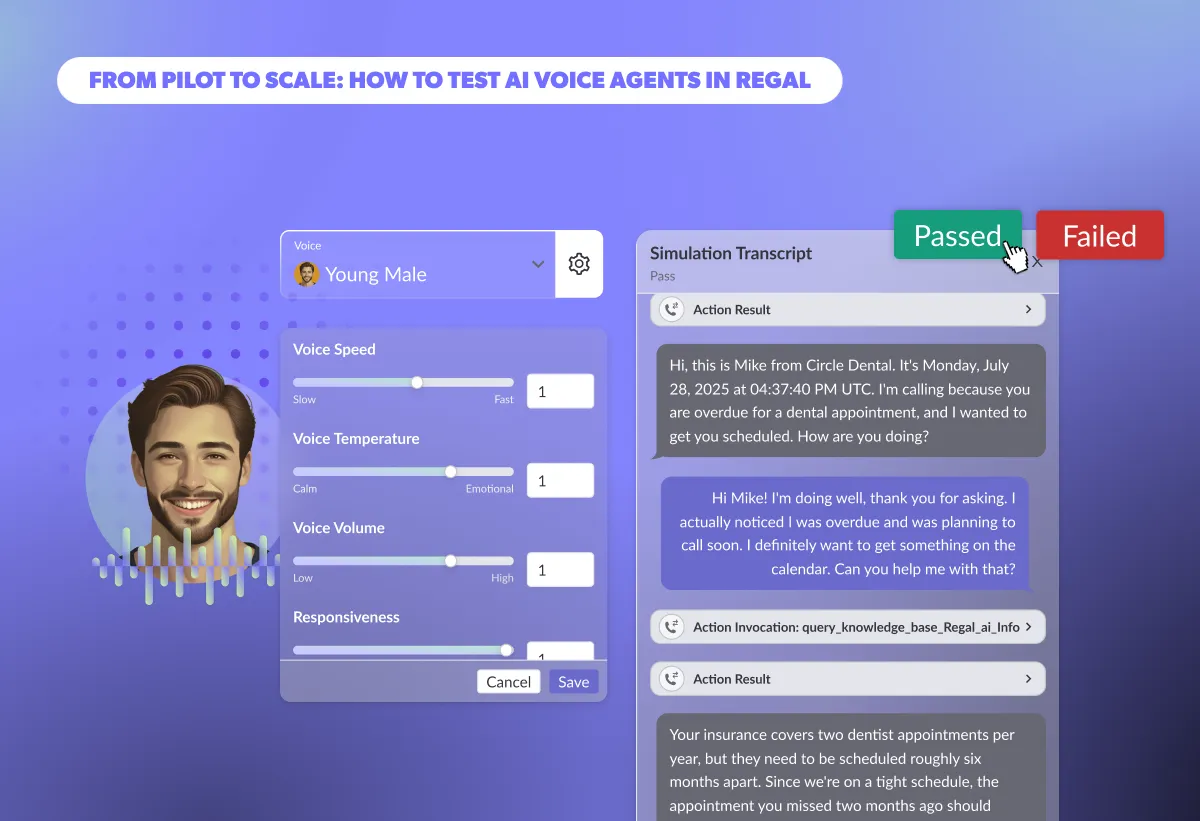
Discover how you can use Simulations to evaluate scenario-specific conversational flows that pinpoint AI Agent failures before launch. Speed up regression testing, validate prompts, knowledge bases, and custom actions at scale, and deploy reliable AI Agents with confidence.
%20(1).webp)
Apple’s iOS 26 introduces new call-screening controls that will reshape outbound performance. This guide explains what’s changing, how adoption may impact enterprise contact centers, and the proactive steps leaders can take now to protect answer rates and customer trust.

Learn how to maintain a clean, reliable RAG system for AI Agents. Discover best practices for structuring source docs, chunking content, titling for retrieval, avoiding redundancy, and keeping knowledge bases fresh to ensure accurate, scalable performance.
.webp)
This article outlines the core characteristics that influence how voice AI is perceived on live calls. From mechanical traits like speed and volume, to more emotional and conversational behaviors, we’re going to look at what those characteristics mean, why they matter, and how they impact your bottom line.
.webp)
Learn how to configure your AI Voice Agent for real performance. This guide covers the most important voice settings in Regal, what ranges top brands use in production, and how adjusting speed, tone, and responsiveness impact cost, containment, and overall customer experience.
AI Agents for Education are transforming student engagement—boosting enrollment, improving retention, and making support more human. Discover 8 game-changing use cases that free up your staff while delivering better student outcomes.

Regal is officially one of Forbes America’s Best Startup Employers 2025, ranking #164 out of 500. This recognition is a testament to our incredible team, our innovative work culture, and our unwavering commitment to advancing AI technology.

AI in education is helping to streamline admissions, automate student engagement, and enhance higher ed outreach. Discover key education technology trends to boost enrollment and learn why automated student engagement tools are the future.
.webp)
When it comes to comparing AI Agents vs. AI Assistants, Siri & Alexa handle simple tasks, but Gen AI Voice Agents—like Regal’s AI Phone Agent—drive real business impact with human-like conversations, automation, and seamless integration.

As AI technology continues to evolve, the use cases for AI Voice Agents in contact centers will only increase. By answering these six key questions, you can identify where AI agents fit best today in your contact center and plan for future integrations.

Consumer businesses are implementing AI-enabled customer experiences without any change in behavior on the part of consumers, which is leading AI to become common with more speed than past transitions like the internet and the smartphone. And it means that the next step in AI will not come from the LLM providers. The next big step forward in AI rests in the hands of consumer businesses.

Explore Eric Hauser's remarkable career journey from GovTech to healthcare disruption at Cadence, highlighting the transformative power of innovation, collaboration, with a special focus on the pivotal role of Regal in driving patient engagement and outcomes.

Discover how Regal.io's AI-powered personalized outreach solutions are revolutionizing outbound sales and customer experience across industries like healthcare, finance, and insurance in our latest eBook, "Modernizing Outbound Contact Centers: How to Treat Millions of Customers like One in a Million."
.jpeg)
Combining collaboration functionality into CCaaS workflow tools invites more cross-functional users from a company to participate in designing the end-customer experience, leading to better omni-channel orchestration and customer outcomes. Learn more about Regal's collaboration features.
Ready to see Regal in action?
Book a personalized demo.


.avif)
.webp)
.webp)
.webp)

.webp)
.webp)
.webp)
.avif)
.webp)


.webp)

.webp)
.webp)
.webp)

%20(1).webp)
.webp)
%20(1).webp)
.png)
.webp)
.webp)
.webp)
.webp)
%20(1).webp)
%20(1).webp)
%20(1).webp)
.webp)
.webp)
.webp)
.webp)
%20(1).webp)

.webp)


%202.webp)


.webp)
.webp)
.webp)
.webp)


.avif)


